Data Science Fun with the OOW Mix Session Voting Data
Over the past few weeks Oracle Mix had opened the Oracle OpenWorld 2011 Suggest-a-Session to the general public where anyone could submit or vote on a session. One limitation of the Oracle Mix site was that it was impossible to sort the sessions by votes but that challenge was tackled by Roel Hartman with his blog post and APEX demo. After seeing the top session by votes, it was very interesting to me that around half of the top 15 sessions were all from the same author. That got me thinking…and that thinking turned into a little data hacking project that I embarked on. Now I admit it, I think data is very cool, and even cooler is extracting patterns and neat information from data.
Getting the Data
The Oracle Mix site is very “crawler friendly” – it has well defined code and tags which made extracting the data fairly painless. The basic process I used came down to this:
- Get the listing of all the session proposals. That was done by going to the Mix main proposal page and walking all 43 pages of submissions, scraping the direct URL to each session.
- Now that I had all of the session abstract URLs, grab each of those pages, all 424 of them
- From each session page, extract the relevant bits: Session Name, Session Author, Total Vote Count, and most importantly, who voted for this session.
I did all of that with curl, wget and some basic regex as a “version 1” but was hoping to go back and try it again using some more sexy technology like Beautiful Soup. That will have to be continued…
The Social Network Effect
With Oracle Mix Suggest-a-Session, people generally vote for a session for one of two reasons:
- They are generally interested in the session topic
- The session author asked them to vote because of their social relationship
What I think is interesting to know is just how much of the voting is done because of #2. After all, Oracle Mix is a social networking site so there certainly is some voting for that reason. In fact, one of the session authors, Yury Velikanov from Pythian, even blogged his story of rounding up votes. The data shows us this, but more on that in just a bit…
The (Unofficial) Data
I took some time to mingle around the data and found some very interesting things. Let’s just start with a few high level points:
- There were 424 sessions submitted from 252 different authors.
- There were 10,125 votes from 2,447 unique voters.
- The number of submissions ranged from 1 to 24 per author.
Here are some interesting tidbits I extracted from the data set (apologize for not making a cool visualization chart of all this - but I’ll make up for it later):
-- top 10 sessions by total votes:
+-------------+-----------------+--------------------------------------------------------------------------------+
| total_votes | session_author  | title                                                                          |
+-------------+-----------------+--------------------------------------------------------------------------------+
|         167 | tariq farooq    | Oracle RAC Interview Q/A Interactive Competition                               |
|         156 | tariq farooq    | Database Performance Tuning: Getting the best out of Oracle Enterprise Manager |
|         137 | tariq farooq    | Overview & Implementation of Clustering & High Availability with Oracle VM     |
|         130 | tariq farooq    | Migrate Your Online Oracle Database to RAC Using Streams and Data Pump         |
|         127 | tariq farooq    | 360 Degrees - Achieving High Availability for Enterprise Manager Grid Control  |
|         126 | yury velikanov  | Oracle11G SCAN: Sharing successful implementation experience                   |
|         124 | sandip nikumbha | Accelerated Interface Development Approach - Integration Framework             |
|         123 | tariq farooq    | Oracle VM: Overview, Architecture, Deployment Planning & Demo/Exercise         |
|         123 | sandip nikumbha | Remote SOA - Siebel Local Web Services Implementation                          |
|         119 | yury velikanov  | AWR Performance data mining                                                    |
+-------------+-----------------+--------------------------------------------------------------------------------+

-- top 10 voters (who place the most votes)
+--------------------+--------------+
| voter_name         | votes_placed |
+--------------------+--------------+
| arup nanda         |           53 |
| tariq farooq       |           43 |
| connie cservenyak  |           36 |
| xiaohuan xue       |           36 |
| bruce elliott      |           36 |
| peter khoury       |           35 |
| yugant patra       |           35 |
| balamohan manickam |           35 |
| suresh kuna        |           34 |
| eddie awad         |           34 |
+--------------------+--------------+

-- top 10 voters by unique session authors (how many unique authors did they vote for?)
+--------------------+----------------+
| name               | unique_authors |
+--------------------+----------------+
| arup nanda         |             28 |
| paul guerin        |             24 |
| eddie awad         |             24 |
| bruce elliott      |             23 |
| xiaohuan xue       |             23 |
| connie cservenyak  |             23 |
| peter khoury       |             22 |
| wai ling ng        |             22 |
| yugant patra       |             22 |
| balamohan manickam |             22 |
+--------------------+----------------+

-- top 10 session authors by total votes received, number of sessions, avg votes per session
+---------------------+-------------+----------+-----------------------+
| session_author      | total_votes | sessions | avg_votes_per_session |
+---------------------+-------------+----------+-----------------------+
| tariq farooq        |        1057 |        8 |              132.1250 |
| yury velikanov      |         557 |        5 |              111.4000 |
| alex gorbachev      |         429 |        6 |               71.5000 |
| sandip nikumbha     |         360 |        3 |              120.0000 |
| syed jaffar hussain |         281 |        4 |               70.2500 |
| kristina troutman   |         233 |        5 |               46.6000 |
| russell tront       |         221 |        3 |               73.6667 |
| wendy chen          |         217 |        3 |               72.3333 |
| asif momen          |         184 |        2 |               92.0000 |
| alison coombe       |         183 |        5 |               36.6000 |
+---------------------+-------------+----------+-----------------------+
Diving In Deeper
I could not help noticing that Tariq Farooq had the top 5 spots by total vote count. I would assert that is related to these two points:
- Tariq has some very interesting and apealing sessions
- Tariq has lots of friends who voted for his sessions
I have no doubt there there is some of both in the mix, but just how much influence on the votes is there from a person’s circle of friends? Or to put another way: How many voters only voted for a single session author? Or even more interesting, how many people voted for every session for a single author, and voted for no other sessions? All good questions…with answers that reside in the data!
-- number of users who voted for exactly one author
+---------------------------+
| users_voting_for_1_author |
+---------------------------+
|                       828 |
+---------------------------+

-- number of voters who voted for every session by a given author
-- and total # of votes per voter is the same # as sessions by an author
+-------------------------------------------------+
| users_who_voted_for_every_session_of_an_author |
+-------------------------------------------------+
|                                             826 |
+-------------------------------------------------+
Wow - now that interesting! Of people only voting for a single session author, just two of them did not vote for every one of that author’s sessions. That’s community for you!
Visualizing the Voting Graph
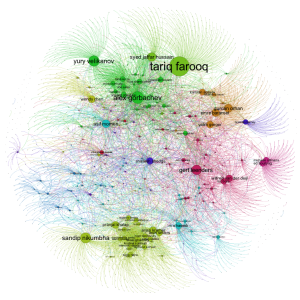
I was very interested to see what the Mix Voting Graph looked liked, so I imported the voting data into Gephi and rendered a network graph. What I was in search of was to identify the community structure of the voting community. Gephi lets you do this by partitioning the graph into modularity classes so that the communities become visible. This process is similar to how the LinkedIn InMap breaks your professional network into different communities.
Here is what the Oracle Mix voting community looks like:
This is a great visualization of the communities and it accentuates the data from above - the voters who only voted for a single author. This can be seen by the small nodes on the outer part of the graph that have just a single edge between it and the session author’s node. Good examples of this are for Yury Velikanov and Tariq Farooq. Also clearly visible is what I’d refer to the “Pythian and friends” community centered around Alex Gorbachev and Yury Velikanov in the darker green color. There are also several other distinct communities and the color coding makes that visible.
Shouts Out
This is my first real data hacking attempt with web data and using some of the tools like Gephi for the graph analysis. One of my inspirations was Neil Kodner’s Hadoop World 2010 Tweet Analysis, so I need to give a big shout out to Neil for that as well as his help with Gephi. Thanks Neil!
And One Last Thing
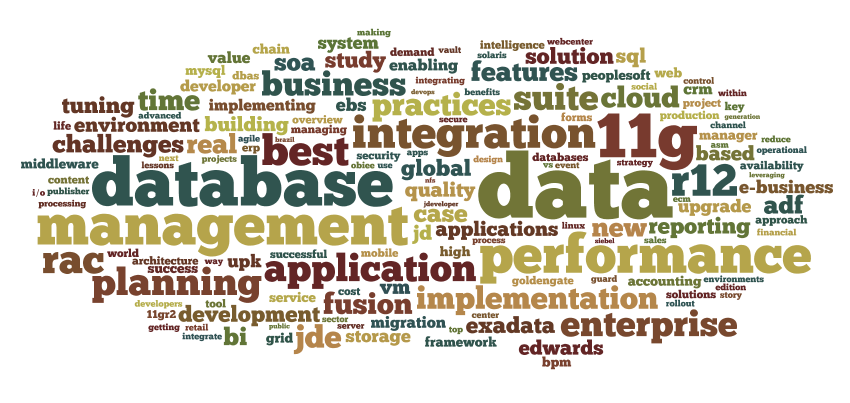
So what are people’s sessions about that were submitted? This Wordle says quite a bit.

Source
If you wish to play on you own: https://github.com/gregrahn/oow-vote-hacking
Addendum
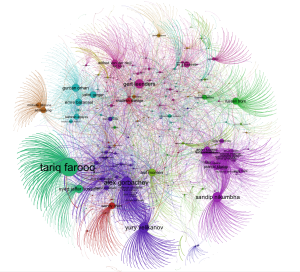
Here is another graph where the edges are weighed according to votes to an author (obviously related to number of sessions for that author).

