Linux 6 Transparent Huge Pages and Hadoop Workloads
This past week I spent some time setting up and running various Hadoop workloads on my CDH cluster. After some Hadoop jobs had been running for several minutes, I noticed something quite alarming – the system CPU percentages where extremely high.
Platform Details
This cluster is comprised of 2s8c16t Xeon L5630 nodes with 96 GB of RAM running CentOS Linux 6.2 with java 1.6.0_30. The details of those are:
$ cat /etc/redhat-release
CentOS release 6.2 (Final)

$ uname -a
Linux chaos 2.6.32-220.7.1.el6.x86_64 #1 SMP Wed Mar 7 00:52:02 GMT 2012 x86_64 x86_64 x86_64 GNU/Linux

$ java -version
java version "1.6.0_30"
Java(TM) SE Runtime Environment (build 1.6.0_30-b12)
Java HotSpot(TM) 64-Bit Server VM (build 20.5-b03, mixed mode)
Observations
Shortly after I kicked off some Hadoop jobs, I noticed the system CPU percentages were extremely high. This certainly isn’t normal for this type of workload and is pointing to something being wrong or a bug somewhere. Because the issue was related to kernel code (hence high system times), I fired up perf top and tried to see where in the kernel code all this time was being spent (thanks @kevinclosson). Here is single iteration from perf-top which was representative of what I was seeing:
PerfTop:   16096 irqs/sec  kernel:92.6%  exact:  0.0% [1000Hz cycles],  (all, 16 CPUs)
-------------------------------------------------------------------------------------------------------------------

             samples  pcnt function                                                              DSO
             _______ _____ _____________________________________________________________________ __________________

           223182.00 93.8% <a href="http://lxr.free-electrons.com/source/kernel/spinlock.c?v=2.6.32#L72">_spin_lock_irq</a>                                                        [kernel.kallsyms]
             3879.00  1.6% <a href="http://lxr.free-electrons.com/source/kernel/spinlock.c?v=2.6.32#L64">_spin_lock_irqsave</a>                                                    [kernel.kallsyms]
             3260.00  1.4% <a href="http://lxr.free-electrons.com/source/mm/compaction.c?v=2.6.35#L302">compaction_alloc</a>                                                      [kernel.kallsyms]
             1992.00  0.8% <a href="http://lxr.free-electrons.com/source/mm/compaction.c?v=2.6.35#L378">compact_zone</a>                                                          [kernel.kallsyms]
             1714.00  0.7% SpinPause                                                             libjvm.so
              716.00  0.3% get_pageblock_flags_group                                             [kernel.kallsyms]
              596.00  0.3% ParallelTaskTerminator::offer_termination(TerminatorTerminator*)      libjvm.so
              169.00  0.1% _cond_resched                                                         [kernel.kallsyms]
              114.00  0.0% _spin_lock                                                            [kernel.kallsyms]
              101.00  0.0% hrtimer_interrupt                                                     [kernel.kallsyms]
At this point I decided to take a 60 second capture using perf record using the following command:
$ sudo perf record -a -g -F 1000 sleep 60
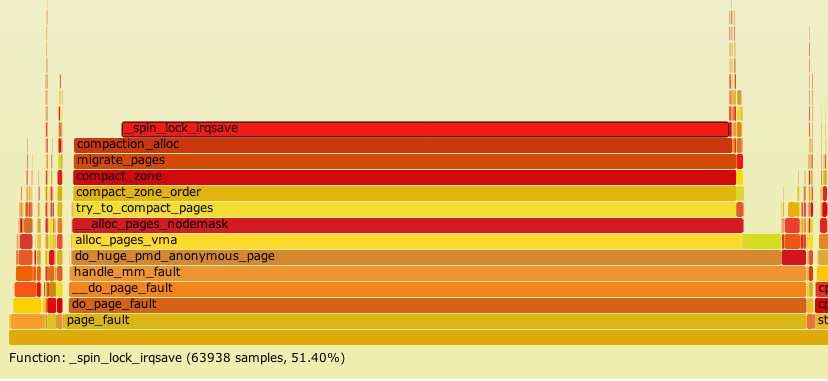
After I had the capture, I built a flame graph using Brendan Gregg’s tools (because I am a big fan of performance data visualizations).
Looking at the functions listed in the Flame Graph (below) it looked like the issue was related to virtual memory and the Linux source shows many of these functions are in linux/mm/compaction.c.

The issue seemed to be around virtual memory, however, this Hadoop job was using just 8 mappers per node and the java heap was set to 1GB, so there was plenty of “leftover” memory on the system, so why would this system be thrashing in the vm kernel code?
Experiment
While eating dinner and having a few beers something came to mind – Linux 6 had a new feature called Transparent Huge Pages, or THP for short. And like all new features that are deemed to add benefit, it is enabled by default. THP can be disabled by running the following command:
echo never > /sys/kernel/mm/redhat_transparent_hugepage/enabled
And this change, and only this change, is exactly what I did when I returned from dinner. I then fired off my Hadoop job and watched anxiously. To my pleasant surprise, the elevated sys CPU times were now gone and things looked much more like I wanted them to.
I’ve flipped back and forth several times and have had nothing but high sys times with THP enabled, so it’s pretty reproducible on my system.
Thoughts
I’m not 100% sure why THP are choking up my system (maybe bug vs. feature) but I’m certainly interested if others have seen similar behavior on Linux 6 with data intensive workloads like Hadoop and THP enabled. Other thoughts, experiment results, etc. are also very welcome.
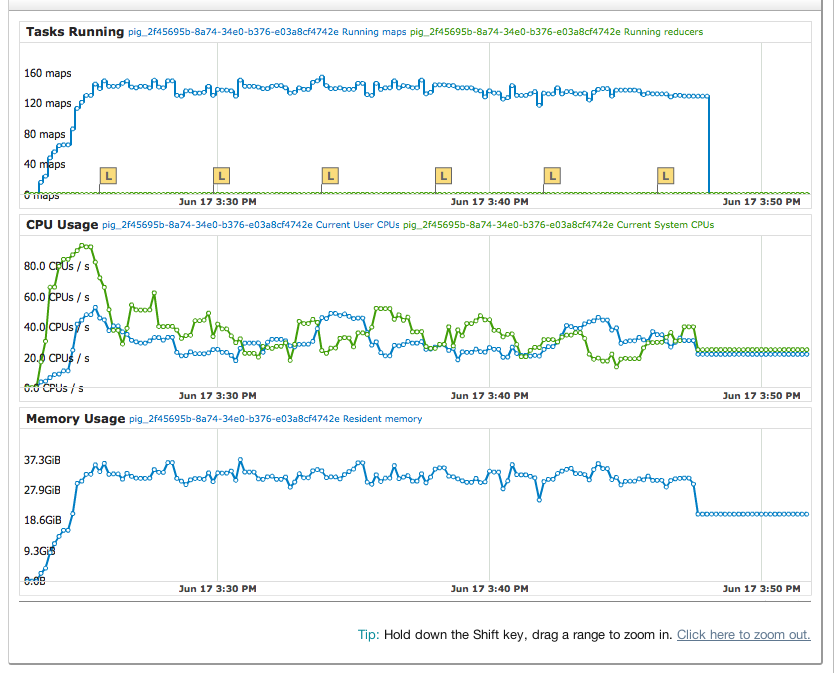
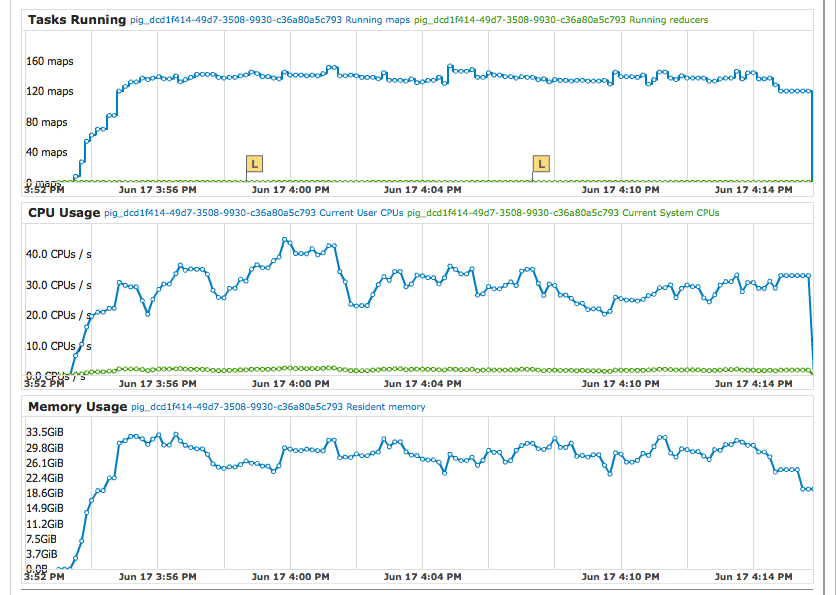
To put things into perspective on how bad it gets, here are two screen captures of Cloudera Manager which highlights the ugly sys CPU times (see the middle chart; green = sys, blue = usr) when THP are enabled.
Do note the time scales are not identical.
Transparent Huge Pages enabled:

Transparent Huge Pages disabled:

Update:
The issue seems to be related to transparent hugepage compaction and is actually documented on the Cloudera Website (but my google foo did not turn it up) here which recommends the following:
echo never > /sys/kernel/mm/redhat_transparent_hugepage/defrag
I did stumble across the bug listed on the Red Hat Bugzilla site in the google cache but it is not publicly available for some reason (bummer). https://bugzilla.redhat.com/show_bug.cgi?id=805593 
Just confirming after I disabled THP defrag on my cluster the high sys CPU times are not present.
Update 2:
Just for documentation’s sake, here are some performance captures between THP enabled and disabled.
# echo never > /sys/kernel/mm/redhat_transparent_hugepage/enabled
# collectl -scm -oT -i2
waiting for 2 second sample...
#         <----CPU[HYPER]----->
#Time     cpu sys inter  ctxsw Free Buff Cach Inac Slab  Map
10:33:08   84   4 46083   6964   5G 324M  61G  60G 563M  25G
10:33:10   71   7 39933  25281   5G 324M  61G  60G 566M  24G
10:33:12   89   4 48545  15724   5G 324M  61G  60G 566M  25G
10:33:14   81   7 44566   8224   7G 324M  61G  60G 566M  23G
10:33:16   81   4 44604   8815   8G 324M  62G  60G 566M  22G
10:33:18   87   7 46906  20430   8G 324M  62G  60G 566M  22G
10:33:20   79   6 43565  11260   6G 324M  62G  61G 565M  24G
10:33:22   75   6 41113  13180   3G 325M  62G  61G 565M  26G
10:33:24   64   5 36610   9745   2G 325M  62G  61G 565M  27G
10:33:26   60   4 34439   7500   1G 325M  62G  61G 565M  28G
10:33:28   74   5 40507   9870   1G 324M  61G  60G 564M  30G
10:33:30   73   6 42778   7023   6G 324M  60G  59G 561M  25G
10:33:32   86   5 46904  11836   5G 324M  61G  59G 561M  26G
10:33:34   78   3 43803   9378   5G 324M  61G  59G 559M  25G
10:33:36   83   4 44566  11408   6G 324M  61G  60G 560M  24G
10:33:38   62   4 35228   7060   7G 324M  61G  60G 559M  23G
10:33:40   75   7 42878  16457  10G 324M  61G  60G 559M  21G
10:33:42   88   7 47898  13636   7G 324M  61G  60G 560M  23G
10:33:44   83   6 45221  17253   5G 324M  61G  60G 560M  25G
10:33:46   66   4 36586   6875   3G 324M  61G  60G 560M  26G
10:33:48   66   4 37690   9938   2G 324M  61G  60G 559M  28G
10:33:50   66   3 37199   6981   1G 324M  61G  60G 559M  28G

# echo always > /sys/kernel/mm/redhat_transparent_hugepage/enabled
# collectl -scm -oT -i2
waiting for 2 second sample...
#         <----CPU[HYPER]----->
#Time     cpu sys inter  ctxsw Free Buff Cach Inac Slab  Map
10:51:31   99  81 51547  14961  24G 326M  53G  51G 536M  15G
10:51:33   92  81 49928  11377  24G 326M  52G  51G 536M  15G
10:51:35   59  58 39357   2440  24G 326M  52G  51G 536M  15G
10:51:37   54  53 36825   1639  24G 326M  52G  51G 536M  15G
10:51:39   88  87 49293   2284  24G 326M  52G  51G 536M  15G
10:51:41   95  94 50295   1638  24G 326M  52G  51G 536M  15G
10:51:43   99  98 51780   1838  24G 326M  52G  51G 536M  15G
10:51:45   97  95 50492   2412  24G 326M  52G  51G 536M  15G
10:51:47  100  96 50902   2732  24G 326M  52G  51G 536M  15G
10:51:49  100  89 51097   4748  24G 326M  52G  51G 536M  15G
10:51:51  100  71 51198  36708  24G 326M  52G  51G 536M  15G
10:51:53   99  56 51807  50767  24G 326M  52G  51G 536M  15G
10:51:55  100  51 51363  66095  24G 326M  52G  51G 536M  15G
10:51:57  100  48 51691  73226  24G 326M  52G  51G 536M  15G
10:51:59   99  36 52350  87560  24G 326M  52G  51G 536M  15G
10:52:01   99  51 51809  42327  24G 325M  52G  51G 536M  15G
10:52:03  100  50 51582  62493  24G 325M  52G  51G 536M  15G
10:52:05   99  44 52135  69813  24G 326M  52G  50G 536M  15G
10:52:07   99  39 51505  65393  24G 326M  52G  50G 536M  16G
10:52:09   98  39 52778  54844  24G 326M  52G  50G 536M  16G
10:52:11   98  62 51456  30880  24G 326M  52G  50G 536M  16G
10:52:13  100  83 51014  21095  24G 326M  52G  50G 536M  16G
Update: 2013-09-17 Oracle comments on disabling THP in Oracle Linux: Performance Issues with Transparent Huge Pages (THP)